Bonzo Vaults: Performance & Data UI/UX Updates

⚠️ This blog post is for educational purposes only and does not constitute financial advice; DeFi protocols are inherently risky and can result in complete loss of funds. By reading this post, you fully acknowledge the risks and disclaimers appended to the bottom of this blog posting.
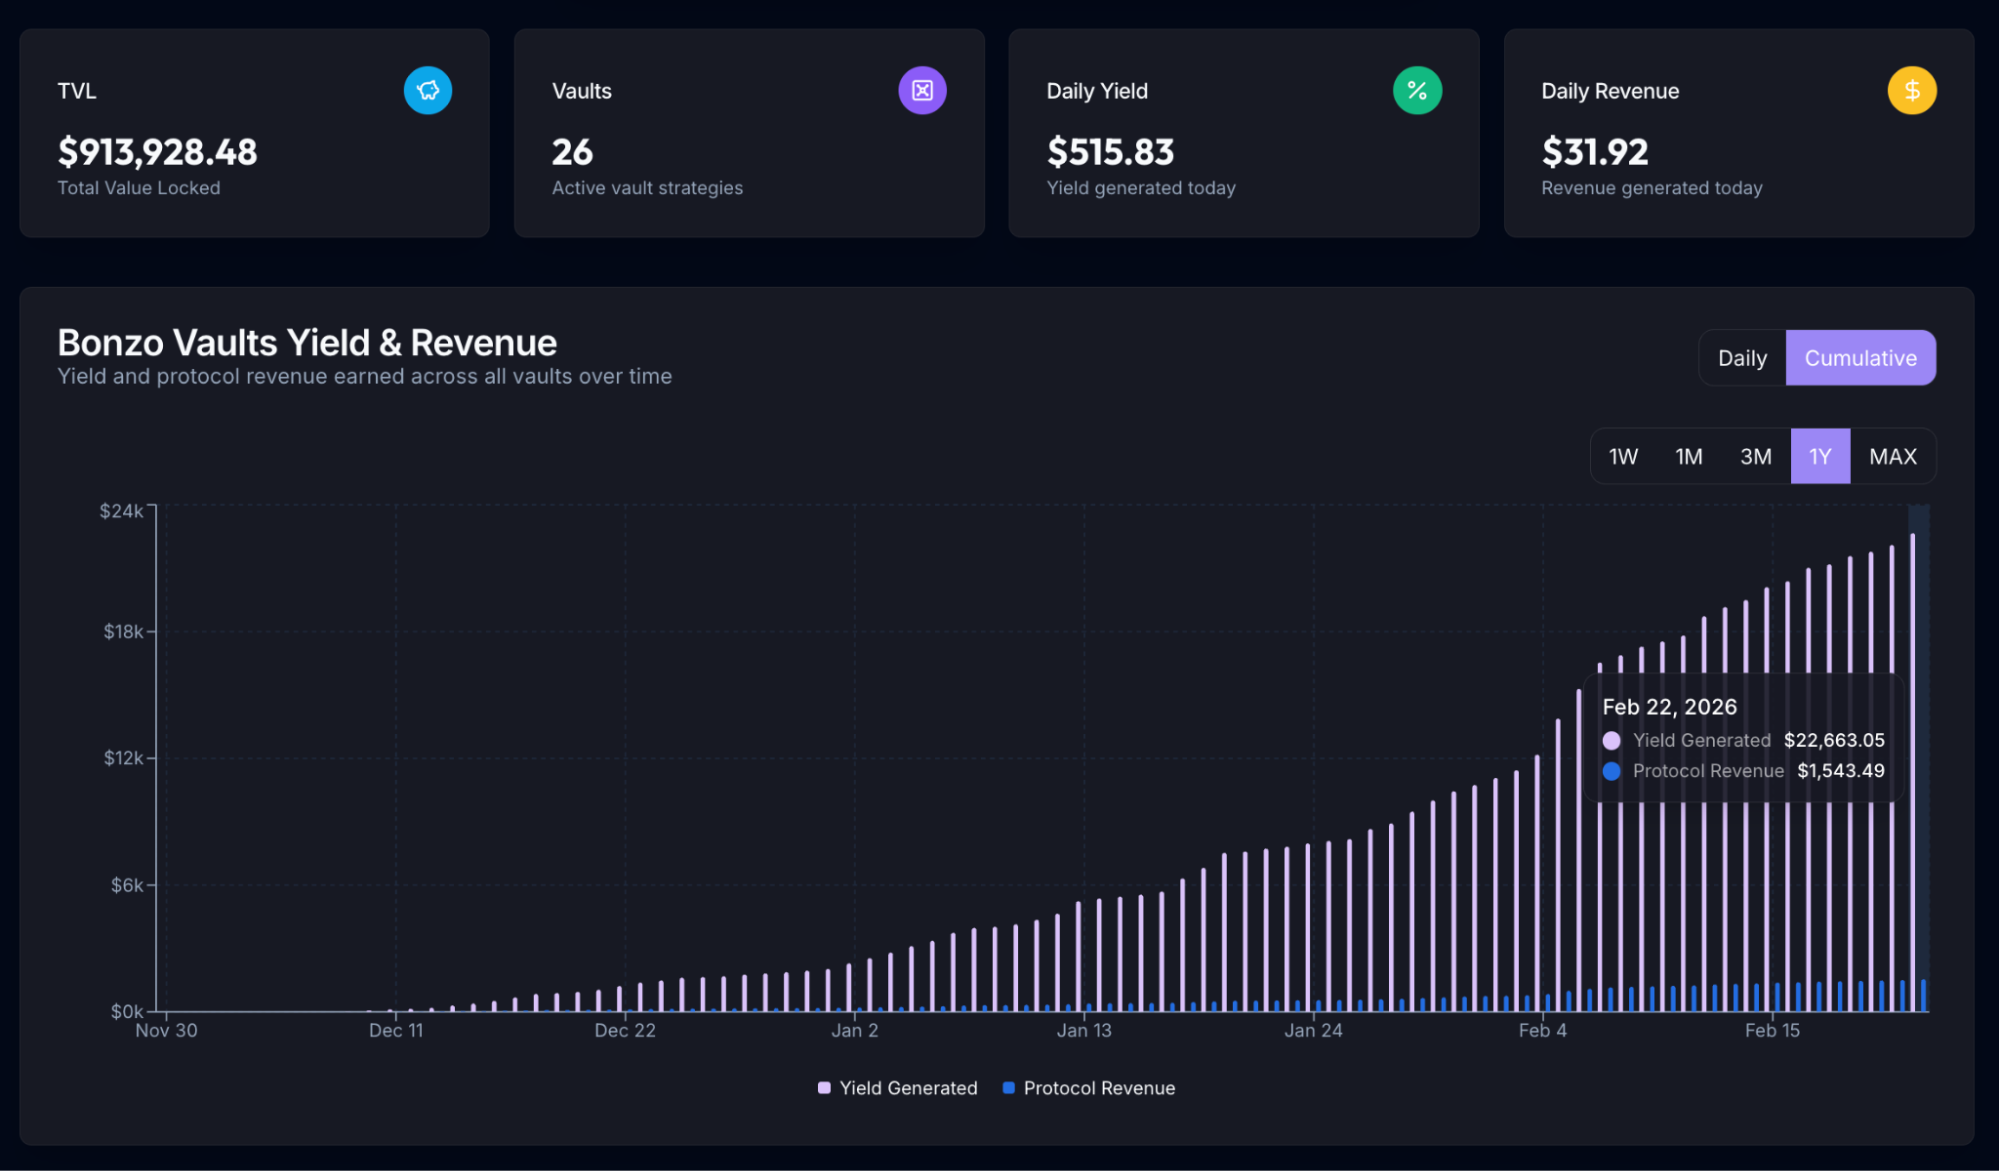
Bonzo Vaults launched in beta late December 2025 with two vault strategies: Single Asset DEX and Dual Asset DEX and currently has $914k in TVL and over $22k in yield generated for users.
These vault strategies have allowed users to deposit either a single asset (paired with another asset) or two assets, respectively, into a Bonzo Vault — the deposited liquidity is automatically routed, managed, rebalanced, and harvested its associated SaucerSwap V2 (concentrated liquidity) pool, reducing complexity and user maintenance, while supporting yield earnings, for those participating in DeFi on Hedera.
Bonzo Vaults are operationally complex, as they’re managing significant amounts of liquidity in real-time, rebalancing said liquidity intelligently, and keeping track of many data points. That data must be conveyed to users clearly and intuitively on the front-end interface — additionally, overarching market conditions have an outsized impact on not just yield generated by the vault but overall position value.
While vaults do attempt to mitigate impermanent loss and capture upside, during times of market volatility and price changes… vaults, just like SaucerSwap V2 concentrated liquidity pool positions, are still exposed to this unavoidable DeFi risk.Throughout the beta period of Bonzo Vaults, the Bonzo Finance Labs team has requested feedback from the early adopter community about their experience, including: UI/UX information displayed for position and vault information, how and which data points are presented, the real-time functioning and informational display of each paired asset, and more.
The Bonzo Finance Labs team is grateful for all of the invaluable feedback by community members and continues to update the protocol’s interface in fast iteration cycles.
Vaults UI/UX & Data Updates
As part of ongoing efforts to ensure the most intuitive experience for Bonzo Vaults users, the Bonzo Vaults front-end interface has been updated to reflect early feedback from the community, with this most recent update being the largest of all updates.
Whether you’re new to Bonzo Vaults or have been using them during the early access beta period — the information below helps explain these UI/UX improvements that help support a better Bonzo Vaults experience for the Hedera DeFi ecosystem.
Dual Asset DEX Vaults
The Dual Asset DEX vault strategy is based on Beefy Finance’s CLM (concentrated liquidity management) strategy — it allows for depositing a ratio of a pair of assets into a Bonzo Vault, which is automatically routed to and managed in a SaucerSwap V2 concentrated liquidity pool. Detailed information about this strategy and the vault’s mechanics can be found in the documentation.
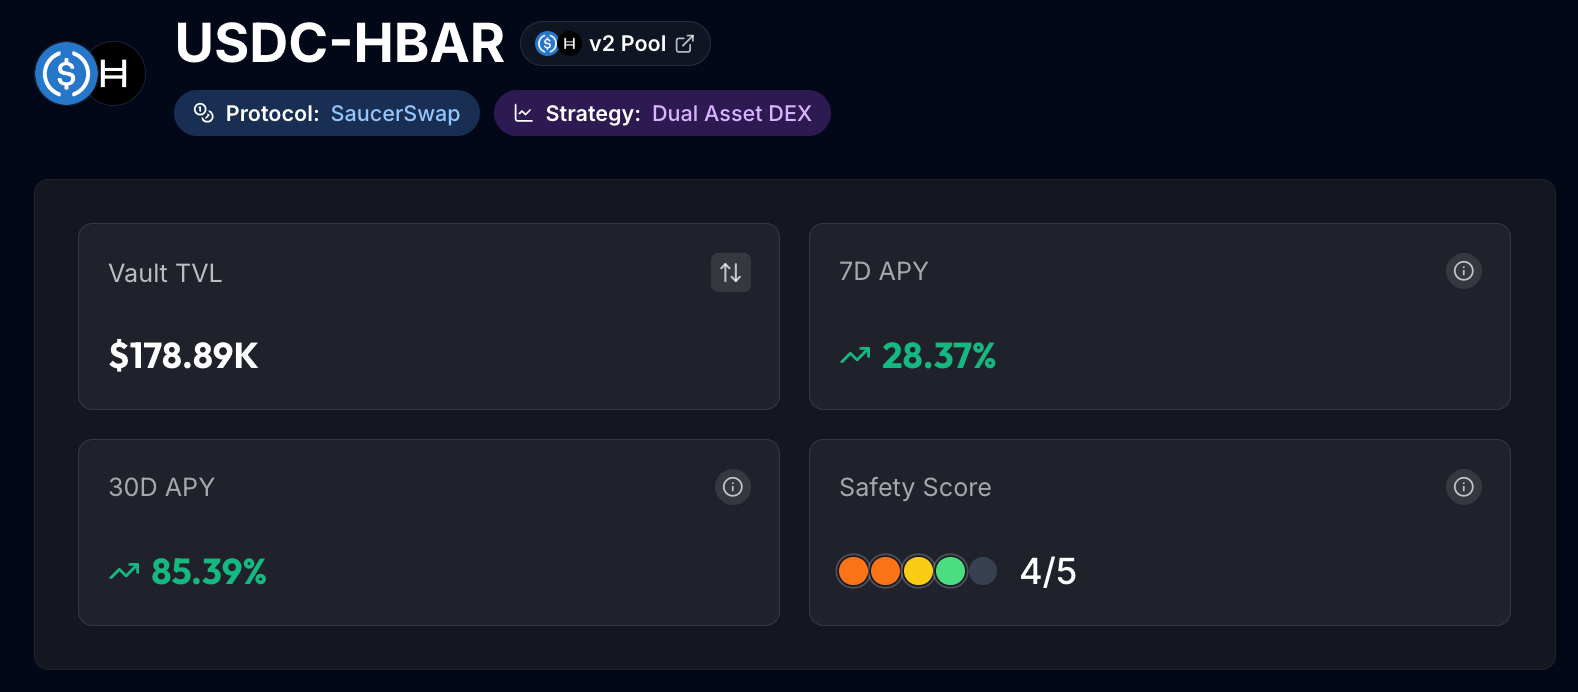
Dual Asset DEX: Greater APY Data Precision
Upon beta availability, the APY information for Dual Asset DEX vaults displayed on both the individual vault pages and the main vaults page was based on the estimated APR (converted to an APY) of the underlying SaucerSwap v2 concentrated liquidity pool.
This estimated APY calculation utilized the width of the vault’s “main range”, and the overall fees earned, to derive a conservative estimate. Dual Asset DEX vaults, upon beta availability, did not yet have enough yield generation data to offer the most precisely accurate estimates.
With Dual Asset DEX vaults having been available in beta for 1+ months, there is enough yield data collected to be able to convey even greater precision in APY estimates, based on actual yield earned by the vault. The interface and data change for Dual Asset DEX vaults includes two APY boxes at the top of each vault page and within each vault’s APY history graph.
Single Asset DEX Vaults
The Single Asset DEX vault strategy is based on ICHI finance’s concentrated liquidity strategy — it allows for depositing a single (primary) asset into a Bonzo Vault, which is automatically routed to and managed in a SaucerSwap V2 concentrated liquidity pool. Single Asset DEX vaults split the initial deposit into a ratio of the primary asset and its paired asset upon deposit; during this split (and as the vault manages deposited liquidity) the vault favors the primary asset and attempts to protect inventory of it.
The vault automatically attempts to shift the ratio of assets throughout various market conditions in order to mitigate downside loss and capture upside gains — users may see the ratio change depending on these market conditions. Detailed information about this strategy and the vault’s mechanics can be found in the documentation.
Single Asset DEX: Position Performance, APYs, & Token Ratios
Single Asset DEX vaults originally utilized $USD denominated values to express position performance, requiring users to run manual calculations on their own if they sought to determine the value of their position and yield in the denomination of the primary asset.
Because users only deposit the primary asset into the vault — and, from feedback received, view the vault’s performance through the lens of how much “more” or “less” of the primary asset amount they have — this update largely reflects changes across the board around denominating metrics in said primary asset.
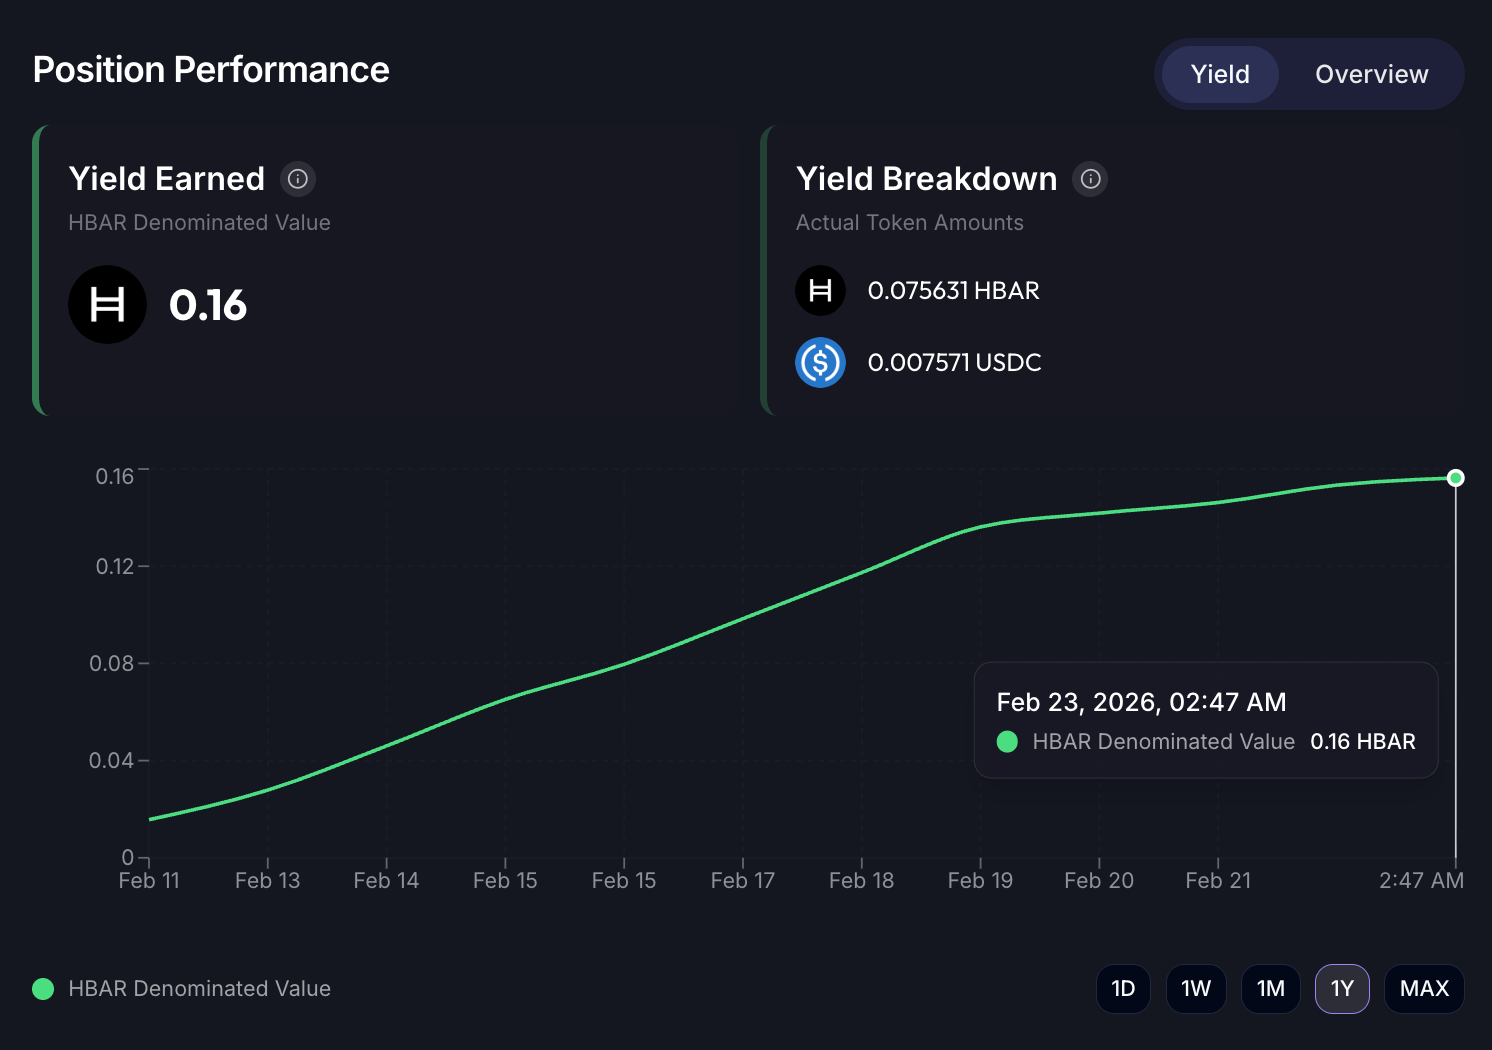
Position Performance: Yield Tab UI Updates
- Restructured Top Metrics:
- "Earnings" is now "Yield Earned": The left box no longer displays a list of unrounded, hyper-specific decimal token amounts. It now shows a clean, single consolidated value denominated in the primary asset (in this case, HBAR).
- "Total" is now "Yield Breakdown": The right box previously just showed the total USD value (e.g., "+$0.01"). It now displays the exact token breakdown of your yield, with decimals cleanly rounded to six places for a much better user experience.
- Simplified Charting (Asset vs. USD Denomination):
- From Stacked Area to Single Line: The graph has transitioned from a stacked area chart plotting multiple assets to a clean, single-line chart.
- Y-Axis Shift: The chart no longer plots yield in USD value. Instead, it tracks the consolidated yield in Primary Asset Denominated Value, giving users a clearer picture of primary asset accumulation, rather than fluctuating fiat values or a split between primary and paired asset values.
- Streamlined Tooltips: Hovering over the graph is much cleaner now. The tooltip previously listed the total USD yield alongside individual asset USD and token values. It now simply shows the date, time, and the total Primary Asset Denominated Value at that exact moment in time.
Overall, these changes make the dashboard feel much less cluttered and focus the user's attention on their actual token growth rather than micro-fluctuations in USD value.
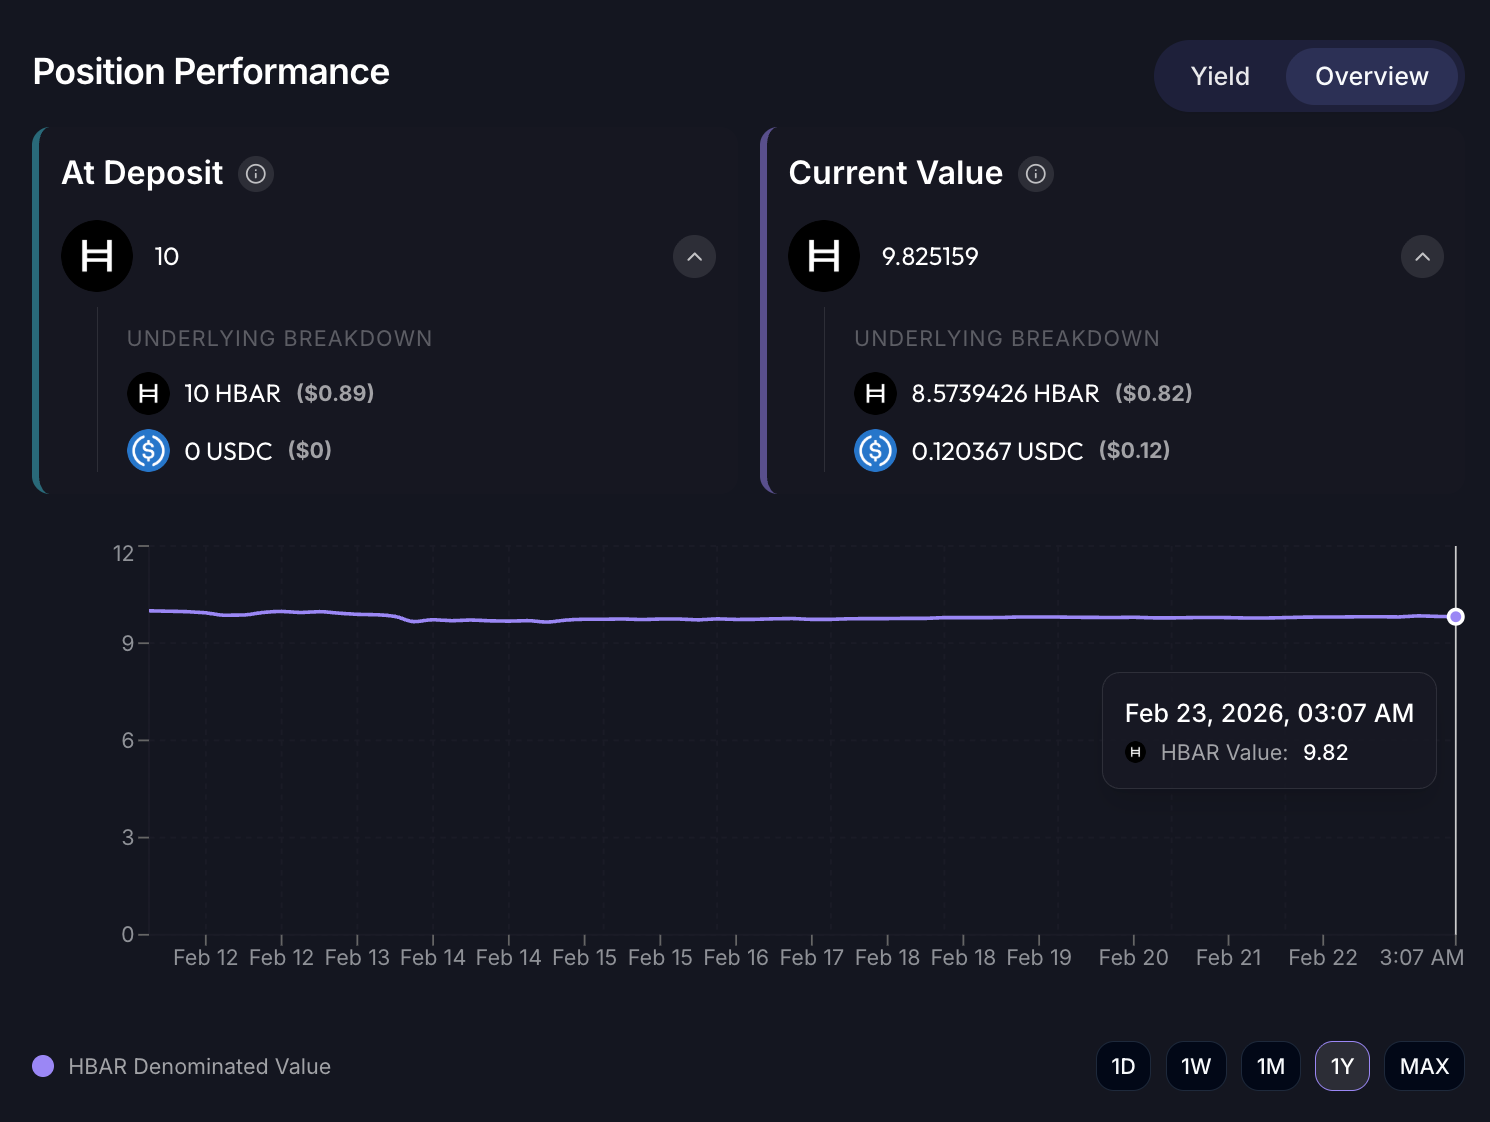
Position Performance: Overview Tab UI Updates
- Collapsible Metric Boxes: The top boxes have been redesigned to feature an expandable/collapsible chevron menu. Instead of flatly listing every asset at once, the boxes now display a clean, top-line value denominated in Primary Asset Denominated Value. Users can click to expand an "underlying breakdown" to see the specific token amounts and ‘at deposit’ / ‘current’ USD values.
- Header Text Change: The left box was updated from ‘Deposit Value’ to ‘At Deposit’.
- Removal of LP Token Clutter: Rows displaying the LP token amount and its associated USD value have been removed from both metric boxes to keep the focus purely on the core assets.
- Shift to Primary Asset Charting: The main graph no longer tracks the overall USD "Position Value". The y-axis and the chart line have been updated to track the ‘Primary Asset Denominated Value’, giving users a clear look at their position's performance in terms of their primary crypto asset.
- Simplified Tooltips: Consistent with the other charts, the hover tooltip has been heavily minimized. It previously displayed a bulky list containing the total USD position value alongside individual Primary and Paired token amounts and their respective USD values. It now simply displays the date, time, and the single HBAR Value.
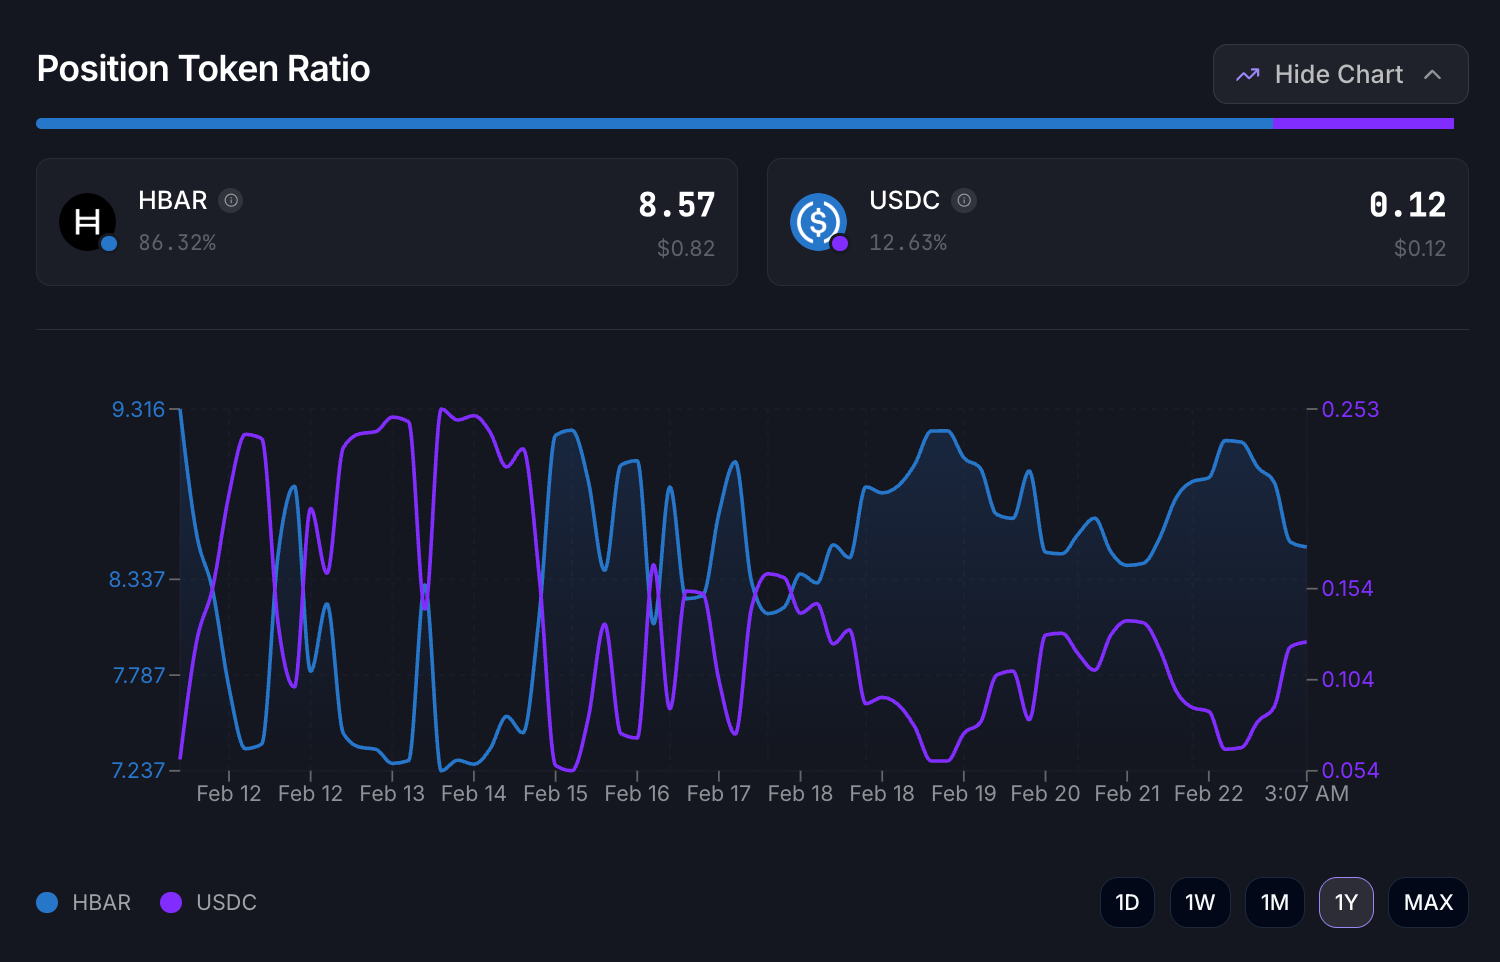
Token Ratios: Primary Deposit
This update shifts the focus heavily toward the actual composition of the position rather than its overall fiat value, making it much easier for users to understand their current exposure at a glance.
- Removal of the "Total Value" Box: The top metric section has been streamlined from three boxes down to two. The overarching "Total Value" USD box was removed to declutter the interface and further support Primary Asset Denominated Amounts being the lens in which to view value.
- New Visual Ratio Bar: A horizontal, color-coded indicator bar has been added across the very top of the component. This gives users an immediate, intuitive visual representation of their asset breakdown — showing a large blue segment for the Primary asset and a smaller purple segment for the Paired asset.
- Percentage Breakdowns Added: The individual asset boxes for Primary and Paired assets now explicitly state the exact percentage weight of each token in the position (e.g., 86.32% for HBAR and 12.63% for USDC in the example below). The previous iteration only displayed the raw token amount and the USD value.
- Consistent Charting: The underlying data visualization remains the same, featuring the dual-axis line chart that tracks the fluctuating amounts of both tokens over time.
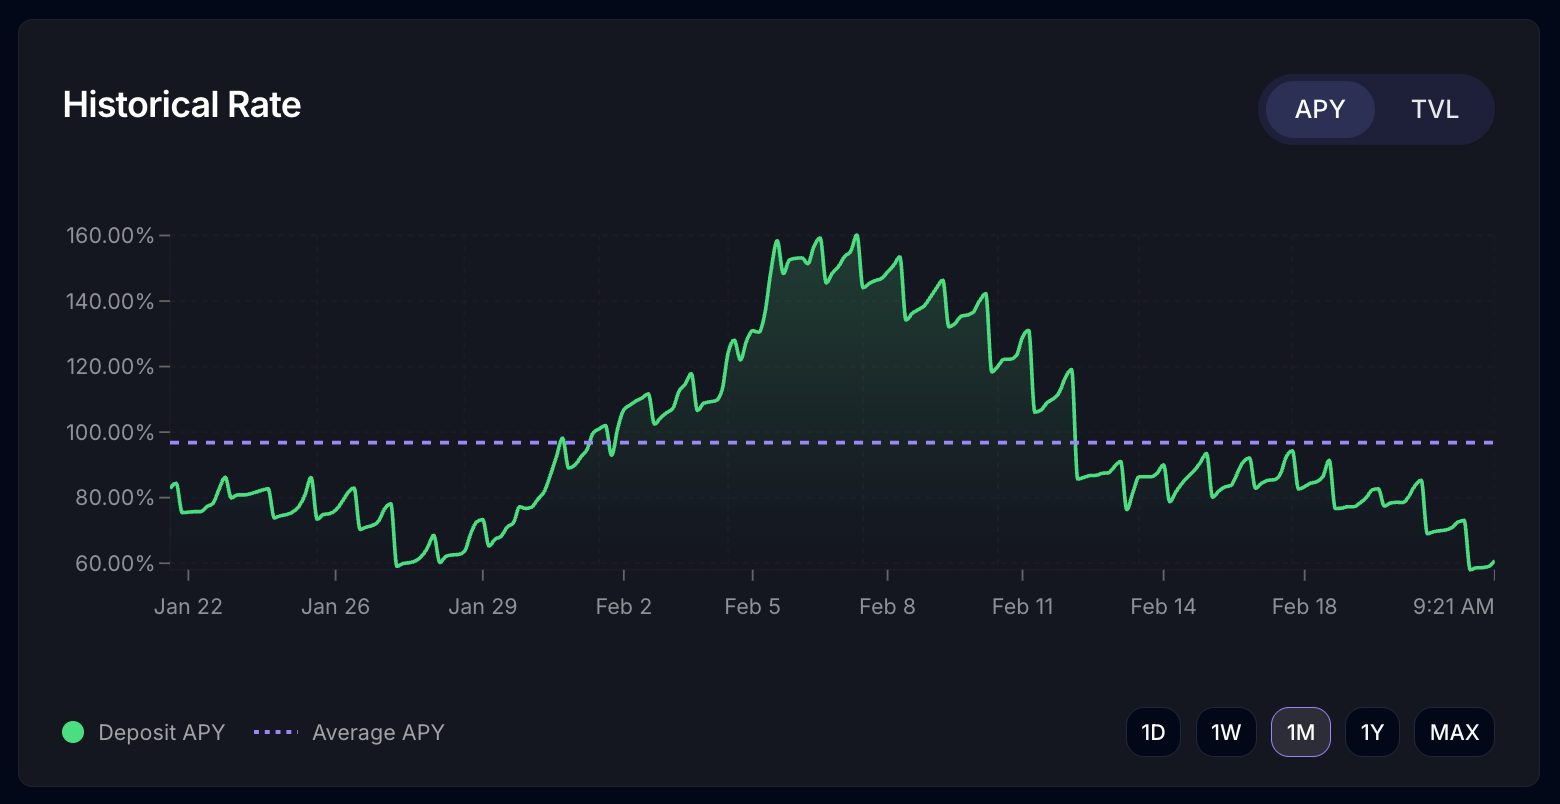
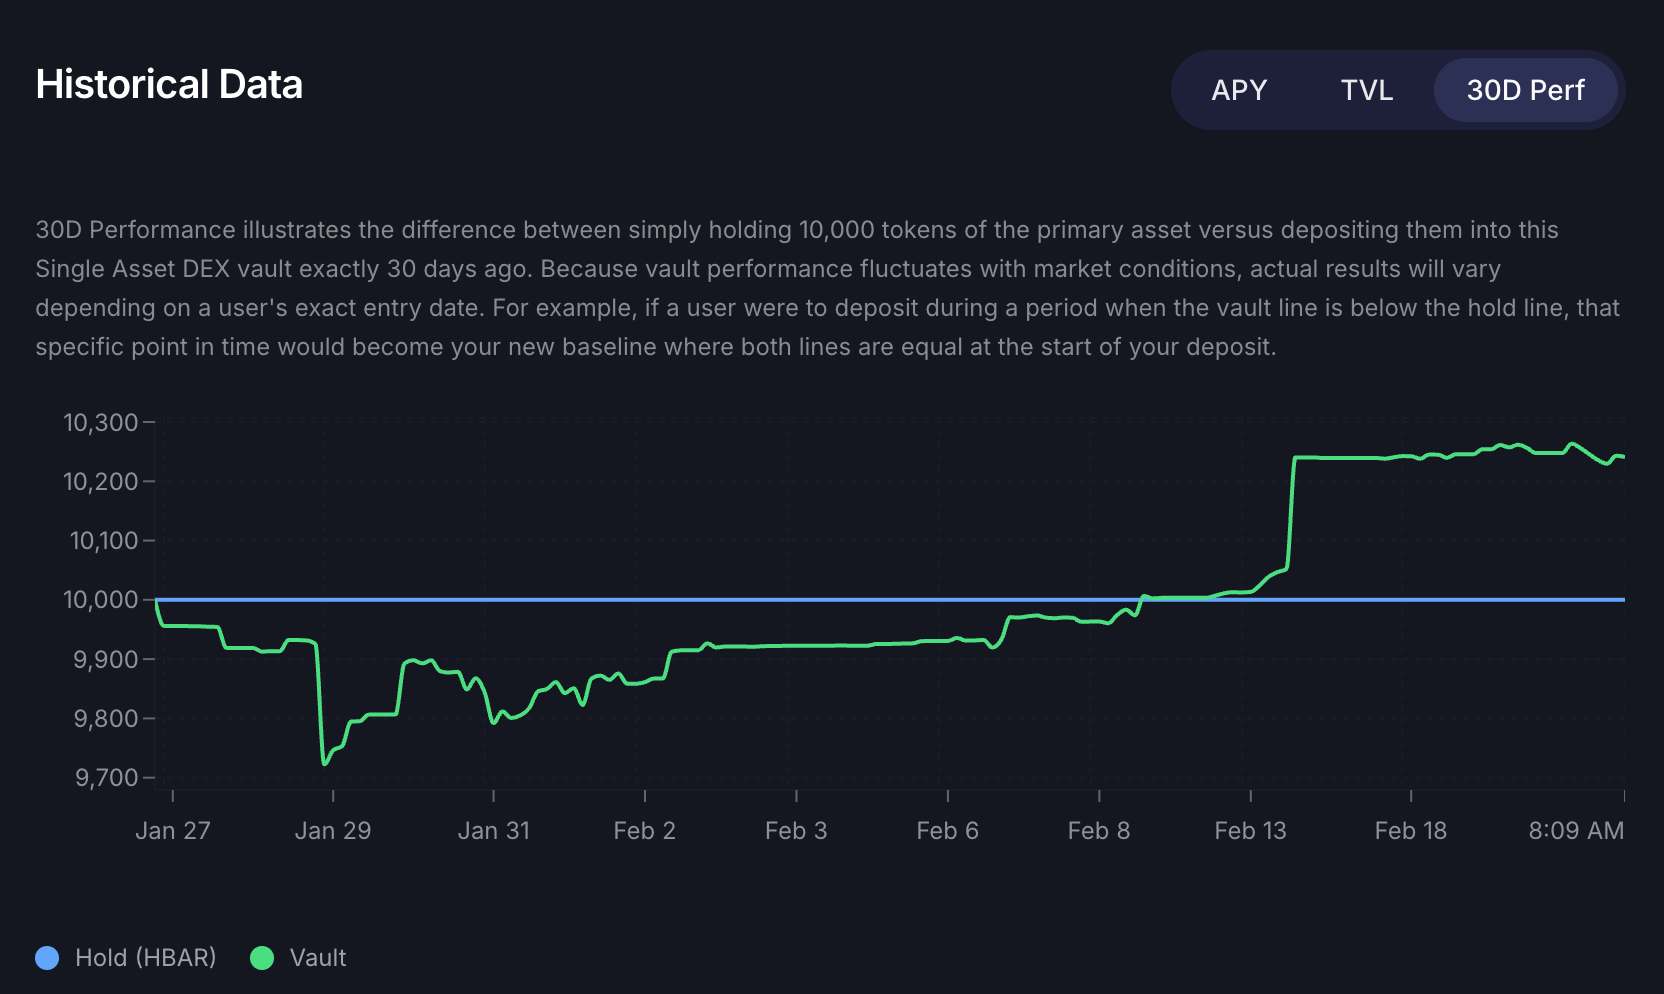
Historical Rate: 30D Performance Comparison
To give users a clearer benchmark of each vault’s 30 day performance, included is a new "30D Perf" tab to the Historical Rate box.
The 30D Performance comparison offers users a better understanding of how — 1) market dynamics 2) the vault’s mechanics and 3) when they both deposit or withdraw — can result in their position being above or below a reference point of just holding the asset. It also better exemplifies vaults being utilized as a long-term tool (amongst many other DeFi tools in the ecosystem), rather than a short-term quick-win strategy.
- Hold vs. Vault: This new graph plots the 30-day performance of the vault's primary asset-denominated value directly against the value of simply holding that primary asset.
- How to read it: The 30D Performance chart illustrates the difference between holding 10,000 tokens of the primary asset versus depositing them into this vault exactly 30 days ago.
- Important Interpretation: Because vault performance fluctuates with market conditions, actual results will vary depending on a user’s exact entry date. The exact date and time when a user deposits during a period should be inferred as the “baseline” (akin to both lines being equal at the start, along with their divergence into the future).
30D Yield View
For the main vaults page, which showcase all Bonzo Vaults, the column for APY has also been updated to reflect 30D yield for each vault. Rationale for this change was two-fold:
- 30D yield for each vault ensures that users see the % yield earned by the vault on a consistent and longer timeframe, rather than the current APY at just that moment in time.
- And with a view of the vault's yield performance over 30 days, it reemphasizes that vaults, rather than being short-term tools, are to be viewed as long-term tools that fluctuate over time.
Final Thoughts
The Bonzo Finance Labs team is very appreciative of community feedback and are committed to continued iteration and innovation on all Bonzo Finance protocol offerings, including Bonzo Vaults. The team remains committed to its support of helping usher in DeFi 2.0 on Hedera, with advanced DeFi offerings.
We’re always open to feedback, thoughts, ideas, and questions — please join us in the official Bonzo Finance Discord. Thank you!
⚠️ Disclaimer
This blog post is provided for informational purposes only and does not constitute financial, investment, legal, or securities advice. The information contained herein should not be construed as an offer to sell, a solicitation of an offer to buy, or a recommendation for any securities or investment strategies.
Risk Disclosure: Participation in decentralized finance (DeFi) protocols involves significant risks, including but not limited to: smart contract vulnerabilities, market volatility, regulatory uncertainty, and potential total loss of funds. Token values may fluctuate significantly and past performance does not predict future results.
No Investment Advice: Nothing in this communication should be interpreted as investment advice or a recommendation to purchase, sell, or hold any digital assets. Participants should conduct their own research and consult with qualified professionals before making any financial decisions.
Forward-Looking Statements: This post contains forward-looking statements regarding the protocol's plans and expectations. Actual results may differ materially from those expressed or implied. The protocol reserves the right to modify or discontinue programs at any time without notice.
Jurisdictional Limitations: This information may not be available to persons in certain jurisdictions where such distribution would be contrary to local law or regulation.
By accessing this information, you acknowledge that you have read, understood, and agree to be bound by these terms and that you are accessing this information at your own risk.
Share this post on