Now Live: Season 3 Points Claims

The Bonzo Finance protocol has concluded Season 3 of its Bonzo Points program on September 3rd, 2025. Claims for 8,000,000 $BONZO governance tokens became available for participants on September 5th, 2025. In addition, Bonzo Points Season 4 kicked-off on September 4th, 2025 and will run through December 8th, 2025.
If you participated in Season 3 of the Bonzo Points program by supplying or borrowing assets between June 3rd, 2025 and September 3rd, 2025, you can claim $BONZO governance tokens until the end of Season 4 (December 8th, 2025) in the Bonzo Finance claim dashboard.
If you experience any issues with claiming or have questions about the program, please open a support ticket in the official Bonzo Finance community Discord.
Season 3 Overview
Season 3 of the Bonzo Points program began on June 3rd, 2025 and ran until September 3rd, 2025. Users earned 2 points for every $1 supplied and 8 points for every $1 borrowed.
The distribution model employed to distribute the 8,000,000 $BONZO governance tokens from Season 3 is an adjusted version of the Concave (√points) regression curve used for Season 1 and Season 2. Details on this adjusted concave / regression curve and alternative token distribution models found across the web3 industry are described in the sections below.
For more information about Bonzo Points seasons, with 4 in total, please visit the official Bonzo Finance documentation.
Token Distribution Models Explained
When designing the token rewards schedule for Season 3 of the Bonzo Points program, an evaluation of past models used for Bonzo Finance point seasons, the most commonly used models seen across web3 protocols, and strategic direction and needs of the protocol for its long-term success, were factored into decision making.
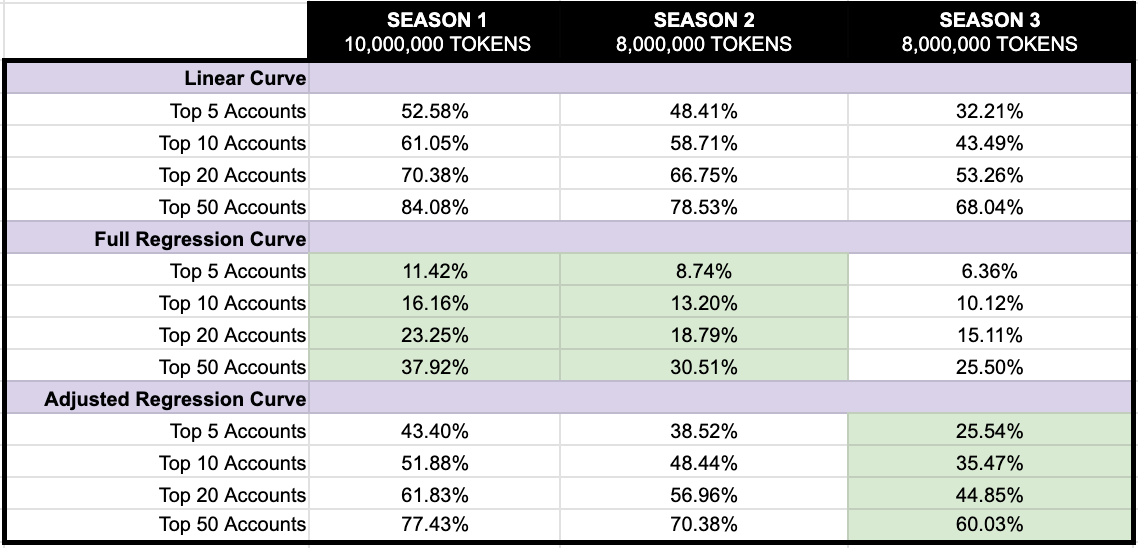
The table below showcases Bonzo Points season token distributions for Seasons 1 - 3 — for the top 5, 10, 20, and 50 accounts on the points leaderboard. It also compares exactly how the distributions would have been allocated, under each of the 3 models described below: Linear, Full Regression Curve, Adjusted Regression Curve.
The cells highlighted in green, per each season, cite the actual token distribution model used and % allocations per top leaderboard account(s).
1) Linear Distribution Model
Linear distribution airdrop / point program models are commonly employed across web3 and other DeFi protocols to reward individual users in direct equivalence to their usage and contribution to the protocol's key success metrics. A linear distribution model has never been utilized for any season of Bonzo Points but is a useful comparison benchmark.
Qualifying usage and contribution may include things like supplying and borrowing funds, contributing to volume via trade execution, or participating in staking, depending on the functionality offered.
Examples of protocols partaking in linear distribution:
- Kamino Finance, the largest lending and borrowing protocol on Solana, strictly uses a linear distribution model for all points seasons since inception; as stated in their governance forums: "Since the first Season of Kamino Points, distributions have been linear. This most effectively rewards the two key user patterns on the protocol: sustained product usage, and continuous KMNO staking."
- Zeta Markets utilizes a linear distribution model, based on a snapshot from users' 'Z-Score', which assigning points based on the volume and frequency of trades. The more one trades, the higher their Z-Score becomes.
Sybil Attack Resistant
A benefit beyond rewarding users with more exact equivalence is that the linear distribution model is inherently "sybil attack" resistant (unlike concave / regression curve distribution models):
Whether a user owns 1 account with $1,000,000 worth of usage (supplying, borrowing, trading, etc.) OR spins up 100 accounts, each with $10,000 worth of usage — the amount of actual tokens distributed (using the calculation below) remains the same; it eliminates any benefit of spinning up multiple accounts to game the system.
[total tokens allocated to the season airdrop] x [total points earned by the account / total points earned across all accounts]2) Fully Concave (√points) Distribution
The fully concave (√points) distribution model was employed by Bonzo Finance for Season 1 and 2 of the Bonzo Points program.
This model is less often employed by protocols, as it skews distribution of token rewards to long-tail point earners, at expense of the protocol's most capitalized and active users. The tradeoff, often acknowledged / accepted by larger point earners, is that it acts as an overall strategic net positive for marketing and community sentiment, especially in the early days of a protocol's establishment.
Not Sybil Attack Resistant
A concave / regression distribution model is not "sybil attack" resistant, unlike linear distribution models, as described in the section above.
If a user creates 100 individual accounts, each with $10,000 worth of usage (supplying, borrowing, trading, etc.), those 100 accounts will earn the same amount of points as a user who owns 1 account with $1,000,000 worth of usage — however, the total amount of tokens distributed to the owner of 100 accounts will be far greater, because the concave / regression model calculates a greater "token per point" value, to accounts sitting on the long-tail of the distribution curve.
3) Adjusted Concave (√points) Distribution
An adjusted concave / regression (√points) distribution model was employed for Season 3 of the Bonzo Points program — this model attempts to strike a balance between rewarding users contributing the greatest amount of dollar-denominated activity and rewarding users in the "long-tail", while just as important, participating with less dollar-denominated value.
Not Sybil Attack Resistant
This adjusted concave / regression distribution model is not inherently "sybil attack" resistant but does support diminishing its negative impact.
Adjusted Model + Moving Forward
As the Bonzo Finance protocol continues to mature and scale, while attracting more users who supply and borrow greater amounts of capital, it's important to ensure all users are treated with fairness; this includes the cohort of users that drive an outsized amount of utilization, which has been growing rapidly over time.
There is no perfect system for running points and airdrop programs across web3 protocols (everyone would be using it, if it existed); operators of community programs make "best judgement" decisions to serve their communities as best as possible, knowing they'll be unable satisfy all desires and expectations of every user — there are always going to be be trade-offs.
Pre-Season, Season 1, and Season 2 of the Bonzo Points program utilized a full regression curve distribution model that offered outsized rewards to long-tail points program participants, as early as possible in the protocol's lifecycle (offering the greatest benefit to long-tail, long-term believers in the protocol's success); this was especially important early on, as there were only a handful of well capitalized accounts who would have single-handedly consumed a majority of token rewards had a linear model been chosen.
After ~10 months of operation and growth and in strategic support of the protocol's long-term scalability goals, Season 3 of Bonzo Points utilized an adjusted version of its rewards distribution model; as expressed in the table above, over time, the number of accounts supplying and borrowing significant capital has grown — this is great for the protocol's success, but called for adjustments to protocol's primary rewards mechanism to ensure fairness and continued growth. This is in-line with other recent activities in support of the protocol's maturation and growth, including the introduction of an independent risk steward and protocol risk parameter "change memo" process.
The Bonzo Finance Labs team is grateful for all feedback received, especially of those critical, as it supports decision making that best satisfies desires and expectations of the entire Bonzo Finance community; feedback will continue to be sought and incorporated into this subsequent Season 4 points program, as well as other community reward programs across the Bonzo Finance ecosystem.
Anti-Sybil Attack Measures in Season 3
During Season 3 of the Bonzo Points program, it was observed that some users participated in "gaming" the points system, due to the points system using a concave / regression curve for tokens distributions (based on points earned).
As described in the above section(s), if a user owns 1 account with $1,000,000 worth of usage vs 100 accounts each with $10,000 worth of usage, the 100 accounts will end up being distributed far more tokens under the concave / regression curve model, as long-tail accounts under this model receive more tokens per point.
The movement of Bonzo Finance 1st Edition and Cybernetic NFTs (to maximize points earned with the multiplier) supported identifying these accounts; NFTs were transferred between accounts in their associated cluster every few days, along with funds.
There were 3 unique individuals ("clusters of accounts") participating in this, based on the analysis performed; across all 3 users, a total of 62 accounts were utilized. Funds and NFTs were transferred within each of clusters every few days, throughout the season.
To remediate, the following steps were taken:
- The points earned across all accounts, within each of the 3 clusters, was accurate (the amount of points would have been the same had they used 1 account or many accounts).
- The total number of points earned per each account, within its associated cluster, was totaled.
- The individual accounts across all clusters were removed from the "concave / regression curve" calculation (which boosted token distributions for all legitimate accounts)
- In their place, 3 accounts (representing each of the clusters) were added back into the "concave / regression curve" calculation.
- The concave / regression curve calculation was performed.
- Token distributions (calculated for each of the "representative" accounts / clusters) were spread amongst the accounts within its associated cluster; the tokens amounts distributed per account within each cluster was based on the % of points earned in each account, relative to total points earned across all accounts in its cluster.
The above practice resulted in each of the 3 users (who owned multiple accounts within their cluster) earning the same number of tokens they would have earned had they not attempted to game the points system.
Removing sybil accounts from the concave / regression curve calculation resulted in a total "savings" of 109,181 $BONZO governance tokens, which were distributed to Season 3 participants as part of the standard concave / regression calculation.
Share this post on